Echo correlation analysis and the acoustic evidence in the Kennedy assassination revisited
DB THOMAS
USDA Subtropical Agriculture Research Laboratory 2301 S. International Blvd, Weslaco, Texas 78596, USA
Science & Justice 2001; 41: 21—32
Received 14 June 2000; accepted 10 August 2000
A Dallas Police Department recording contemporaneous with the Kennedy assassination contains five impulsive sounds that have the acoustic waveform of Dealey Plaza gunfire. One of the sounds matches the echo pattern of a test shot fired from the Grassy Knoll. The shock wave precedence associated with this pattern is consistent with the muzzle velocity of a .30 calibre rifle. Criticism of the acoustic identifications on statistical grounds is based on erroneous assumptions concerning the assignment of values to the parameters that determine the probability that random noises could resemble gunshot patterns. A conservative estimate of the true value of the probability that the putative Grassy Knoll shot is attributable to random radio noise is no greater than 0.037. Alleged asynchroneity of the sounds with the time of the assassination stemmed from several incorrect assumptions. Whatever their origin, the gunshot-like sounds occur exactly synchronous with the time of the shooting.
Echo correlation analysis and acoustic evidence in the Kennedy assassination
One of the forensic issues surrounding the Kennedy assassination is the validity of acoustic evidence for a gunshot emanating from the so-called “Grassy Knoll” [1]. The President’s Commission on the Assassination of President John F Kennedy, more widely known as the Warren Commission, concluded that no more and no less than exactly three shots were fired by a single assassin from a building (Book Depository) at the northeast corner of Dealey Plaza, a park-like area in the downtown district of Dallas, Texas [2]. The number of shots, and therefore, allegations of a wider conspiracy, has been a matter of contention. Acoustic evidence pertaining to this matter was found in recordings of Dallas Police Department radio transmissions contemporaneous with the incident.
The police were using two radio channels for communications at the time of the assassination. Routine transmissions were made over a frequency designated as channel one and were recorded on a sound-actuated Dictaphone belt recorder. An auxiliary frequency, designated channel two, was dedicated to the President’s motorcade and its transmissions were recorded on a sound-actuated Gray Audograph disc machine. Each channel had its own dispatcher and, in accordance with radio protocol, each dispatcher announced the time at regular intervals. The context of the transmissions, and the dispatcher’s time notations on channel two, established that the assassination occurred between 12.30 and 12.31 pm central standard time [3]. Simultaneously, for about five and a half minutes between 12.28 and 12.34 pm, channel one transmissions were dominated by the sound of a motorcycle with a faulty relay causing the radio microphone to switch open intermittently. About half-way through this particular motorcycle transmission there occurs a sequence of static-like noises interpreted by some listeners to be possible gunfire [4].
The Dallas police recordings were acquired by the US Congress, House of Representatives, Select Committee on Assassinations (HSCA), and subjected to a forensic analysis in 1978. An independent laboratory, Bolt, Baranek & Newman inc., of Cambridge, Massachusetts, was contracted to analyse the dictabelt and a first generation taped copy of the channel one transmissions. These acoustic analysts concluded that: the motorcycle with the open microphone was in the President’s motorcade (one of 18); that sounds as loud as gunshots are on the recording; and that these included a sound pattern that might be attributed to a gunshot originating from the Grassy Knoll [5].
Because of a degree of uncertainty attached to this detection a second laboratory was asked to review the evidence. Specialists in sonar applications with the Computer Sciences Department of the City University New York concurred that the recording did include the acoustic signature of a gunshot emanating from the Grassy Knoll. In their final reports, both laboratories estimated that the likelihood of the relevant acoustic pattern being a chance array of random radio noises was no more than 5% [6,7]. Their findings were instrumental in the HSCA’s conclusion that there probably was a conspiracy behind Kennedy’s murder [8].
In 1980, the United States Department of Justice arranged with the National Research Council (NRC) for a reanalysis of the data produced by the HSCA. The NRC panel found evidence that the alleged gunshot sounds were not synchronous with events linked to the assassination and thus concluded that the impulsive sounds on the tape could not be the assassination gunfire [9]. They adopted the alternative theory that the sounds on the tape were most likely random radio noises which by chance gave rise to impulse patterns bearing a resemblance to the echoes of gunfire. The panel specifically recalculated the probability of the sound pattern being a Grassy Knoll gunshot, as opposed to random radio noise, at only 78% [10]. In general practice, the 95% significance level is widely accepted as the standard for rejecting a null hypothesis [11,12]. In this case, the null hypothesis is that the acoustic pattern is not a gunshot from the Grassy Knoll, but random noise, if the probability of the null hypothesis is as high as p = 0.22 as calculated by the NRC, rather than p = 0.05 calculated by the HSCA’s analysts, then the null hypothesis would not be rejected.
In this instance, however, acceptance of the null hypothesis presents a conundrum. If the relevant sounds on the police recording are not synchronous with the shooting, then none of the gunshot-like sounds can be the actual assassination gunfire. Thus, the random radio noise hypothesis would have to explain all of the impulse patterns, not just the alleged Grassy Knoll shot. The calculations of p only applied to the latter. It seems unlikely that a random process would produce impulse patterns resembling four gunshots from the Book Depository building and one from the Grassy Knoll, all within the space of eleven seconds, and nowhere else on the recording. Yet, such would have to be the case for the assertion of asynchroneity to be true.
In this report I will explain how the separate panels arrived at different estimates of p using the same data. Errors led both panels to underestimate the statistical level of significance that should have been attached to the acoustic data. The correct value of p is no greater than 0.037. I also present evidence pertaining to the problem of synchroneity of the relevant acoustic signals with the assassination.
The Acoustic Fingerprints
The percussive noise that is associated with the discharge of a weapon is the muzzle blast. Observed on an oscillograph, the muzzle blast appears as a brief duration (c. 5 msec), large amplitude wave with a narrow peak. Different weapons produce discernibly different waveforms, however, the automatic gain control built into the Dallas Police radio system produced distortion in the signal such that the waveform could not be relied upon for identifying the type of weapon or even if the sound actually was a muzzle blast from a weapon [13]. Alternatively, the limiting circuitry does not affect the time history of the incoming signals. In an urban environment, such as Dealey Plaza, the muzzle blast will resonate off the prominent structures creating echoes. Thus, the pattern of a gunshot in an urban environment appears on an oscillograph as a train of impulses. The time-lag between the muzzle blast and any particular echo is a function of the difference in the distance traveled by the blast from the origin to the microphone and the alternate path distance to the echo producing structure and from there to the microphone. This parameter is the echo delay time and the specific pattern that arises is the acoustic fingerprint. The pattern resulting from each combination of shooter and microphone location is complex and unique and by applying echo location principles one can isolate the origin of the sound, The echo correlation technique has been successfully applied in other cases. For example, the origin of gunfire was determined from recordings in the case of the Kent State shooting and likewise in the Greensboro, North Carolina incident known as the “Commie-Klan shootout” [14].
TABLE 1 Correlations between impulse patterns: six segments of the Dallas Police record and echo patterns from 232 test shots. Time of impulse is relative to the start of the motorcycle motor broadcast in elapsed tape time (Data from BBN Report, Table 11).
|
Time of First impulse |
Microphone Number |
Rifle Location |
Correlation Coefficient |
|
136.2 sec |
|
|
all <0.5 |
|
137.7 sec |
2(5) |
TSBD |
0.8 |
|
|
2(5) |
TSBD |
0.7 |
|
|
2(6) |
TSBD |
0.8 |
|
|
2(6) |
Knoll |
0.7 |
|
139.2 sec |
2(6) |
TSBD |
0.8 |
|
|
2(6) |
TSBD |
0.6 |
|
|
2(10) |
TSBD |
0.6 |
|
|
3(5) |
Knoll |
0.6 |
|
140.3 sec |
2(11) |
TSBD |
0.6 |
|
144.9 sec* |
3(4) |
Knoll |
0.8 |
|
|
3(7) |
TSBD |
0.7 |
|
|
3(8) |
TSBD |
0.7 |
|
145.6 sec |
3(5) |
TSBD |
0.8 |
|
|
3(6) |
TSBD |
0.8 |
|
|
3(8) |
TSBD |
0.7 |
*This impulse was reported at 145.1 by Barger et al, but then corrected to 144.9 by Weiss & Aschkenasy.
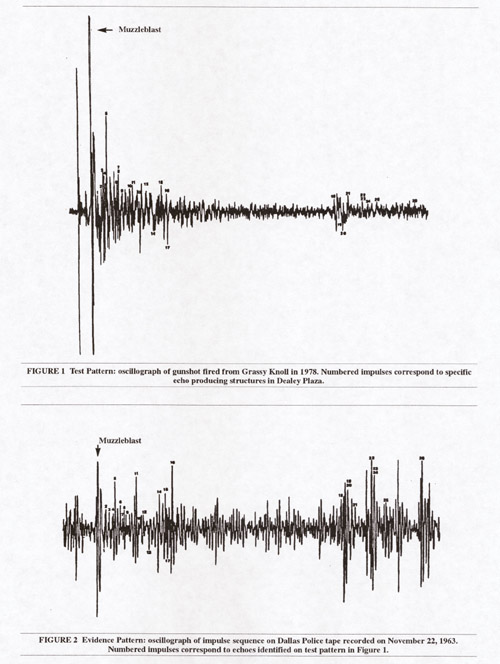
In this case the channel one dictabelt recording contains a series of six such trains of impulses clustered together in a space of 11 seconds which were considered as potential gunshot patterns. The six occur in a sequence between 135 and 146 sec after the beginning of the motorcycle microphone broadcast. There is confusion on this point in some published accounts [1,15] because there are seven, audible, static-like noises on the tape during the relevant interval [16]. However, one of these sounds, the first in sequence, consists of only a single, 15 msec duration impulse [17], and was therefore not included among the six patterns tested as possible gunshots, even though to the unaided ear it is the sound most like a gunshot.
A complicating factor in the analysis is that the six suspect impulse patterns are superimposed on a continuous sequence of impulses representing the piston firings of the motorcycle motor and other background noises. Five of the six suspect patterns consist of numerous, between 8 and 17, large amplitude peaks rising above this background noise [18]. One pattern, the first of the six, included only four large impulses [19], making it unlikely that it arose from the same or similar source as the succeeding five. Nonetheless, this pattern was included in the testing procedure if only because of its proximity to the other suspect patterns.
Echo Delay Time Correlations
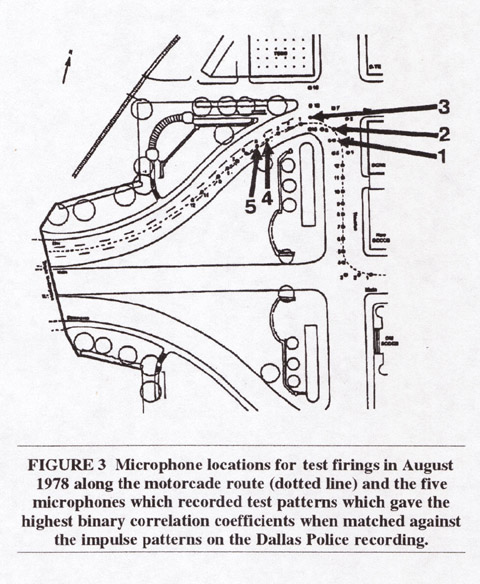
In August 1978 test shots were fired in Dealey Plaza and recorded for comparison with the patterns on the evidence tape. Because the location of the subject motorcycle was unknown, an array of microphones was aligned along the known path of the President’s escort through Dealey Plaza which was northerly on Houston Street then westerly on Elm Street. A total of 36 microphone locations, spaced at 6 m intervals, were used to record gunshots fired from the southeast corner window of the sixth floor of the Book Depository and from near the corner of a stockade fence on the Grassy Knoll. The HSCA analysts compared the test patterns against the six evidence patterns by aligning the peaks and scoring the degree of match using a binary correlation coefficient (r), with,
r = i / sqrt(N x n) (1)
Where, N is the number of impulses in the evidence pattern, n is the number of impulses in the test pattern, and i is the number of coincident impulses [20]. The value of r will be 1 if there is a perfect match, but will approach zero as the degree of similarity decreases.
A perfect match would not be expected even if the evidence patterns were, in fact, gunshots. Firstly, no radio system is free of electromagnetic interference. Even if the patterns were gunshots any given spike could be a static impulse. The static marking rate on the Dallas police tapes averaged 8 per sec [21]. The echo patterns averaged around one-half sec duration [22] and thus would be expected to include some large amplitude peaks attributable to static, Secondly, a perfect match could be obtained only if the subject motorcycle happened to be at exactly the same position as a test microphone. To account for the 6 m spacing between microphones, echo delay times were judged to coincide as long as the correspondent peaks were within ±6 msec [23].
TABLE 2 Elapsed time measurements of DPD tapes seconds (Data from NRC Report, Table C-1).
|
Broadcast |
Channel 1 |
Channel 2 |
|
"Go to Hospital" |
- |
0 |
|
Last Impulse Pattern |
0 |
- |
|
"Hold everything secure" |
0 |
60 |
|
Carillon Bell |
7 |
- |
|
"You want me Stemmons" |
171 |
180 |
With this procedure, five of the six evidence patterns were found to match to one or more of the test patterns to an arbitrarily selected level of r = 0.6 or higher. The first of the six evidence patterns did not match any test pattern and was ruled out as a gunshot [24]. Another evidence pattern, the fourth in order, passed the binary correlation test, but was ruled out as a gunshot based on non-acoustic evidence, The order and spacing of the evidence patterns and the correlation coefficients for each match to the test patterns is shown in Table 1.
Dealey Plaza Sonar Model
One of the evidence patterns matched to a test shot fired from the Grassy Knoll with a correlation coefficient of 0.8. But it was judged that because of the slack in the scoring of coincidence (±6 msec), and with acceptance of less than perfect correlations, there was a reasonable chance that a random grouping of peaks could give a spurious match or “false alarm.” Because of this uncertainty a second laboratory was asked to advance the analysis. The obvious way to tighten the precision of the matching procedure, and thus eliminate false alarms, was to narrow the 6 msec windows used to score coincidence, ideally, the test microphones would have been placed at 0.6 m instead of 6 m intervals and the window of coincidence would be reduced from ±6 msec to ±1 msec. Theoretically, a grid of 180 microphones at 0.6 m spacings would provide saturation coverage of the 12 m wide street and capture a precise match if one existed. However, such procedure would not be practical for several reasons. Most importantly, the subject motorcycle microphone was in motion. During the 370 msec duration of this echo pattern the motorcycle would have moved several feet. For precision to within one msec one would require 180 mobile microphones to simulate the evidence pattern and, moreover, each would have to be traveling at the same velocity and direction as the subject motorcycle. One would also require that the air temperature during the test recordings be approximately the same as at the time of the assassination because the speed of sound is affected by air density which is a function of temperature. Moreover, the shooter location on the Grassy Knoll, whose very existence was a matter of conjecture, would have to be approximately the same (within about 1.5 m) as the location of the person firing the test shots in order to obtain a replicate of the acoustic conditions at the time of the assassination, Such an exacting experiment would be logistically impractical.
Instead, the experiment was performed analytically. A mathematical sonar model of Dealey Plaza was constructed with the aforementioned parameters built in. The template for the model was the acoustic fingerprint of the test shot fired from the Grassy Knoll (Figure 1). Each echo in this pattern was first associated to the physical structure in Dealey Plaza with which it originated. With this information a new fingerprint could be generated for any potential microphone location by simply calculating a new echo delay time for each impulse based on the shift in distance from the structure in question relative to the original microphone location. Then, an adjustment in each echo delay time was factored in to account for air temperature, motorcycle speed and shooter location. All of these factors were known or could be approximated. The test shots were fired in August 1978 when the air temperature was 320C [25]. The air temperature in Dealey Plaza at the time of the assassination on November 22, 1963 was 180C [26]. The FBI laboratory in 1963 had examined motion picture films of the motorcade in Dealey Plaza and had measured the velocity of the President’s limousine at 18 km/hr [27]. It was assumed that the motorcycle escort would be moving at the same approximate speed.
Another factor that was included in the sonar model was a correction for tape speed. Preliminary analysis of the channel one recording revealed that the Dictaphone’s motor was running approximately 5% below normal speed on the day of the assassination [28]. Thus, time on playback is compressed by 5% and precision to ±1 msec requires an adjustment for tape speed.
With this procedure a precise match was found between the evidence pattern (Figure 2) and one analytically generated test pattern. The best fit was generated by assuming that the motorcycle microphone was 1.5 m to the southwest of the test microphone location when the muzzle blast arrived, that the motorcycle was traveling 18 km/hr, that the shooter was 2.5 m west of the corner of the fence on the Grassy Knoll, that the air temperature was 180C, and the tape speed was 4.3 % below normal [29]. By “precise” match it is meant that all 26 predicted echoes on the analytically generated acoustic fingerprint was matched by a corresponding impulse on the evidence tape to within ±1 msec [30].
However, there was an ambiguity inherent to the precision of this match. As previously explained, most of the impulses on the evidence tape were due to motorcycle piston firings. There was no objective way to separate peaks due to piston firings from putative gunshot echoes except by amplitude. Therefore, using an amplitude threshold that would eliminate motor noise, consideration was given only to the large amplitude echoes on the test pattern and the large amplitude impulses on the evidence pattern. Under this procedure, the 13 largest impulses on the analytical test pattern coincided with 11 large peaks in the evidence pattern to ±1 msec [31]. Interestingly, the two peaks in the test pattern which were attendant only to smaller impulses in the evidence pattern were echoes originating with a colonnade arc which was a structure to the front of the motorcycle. It was reasoned that the amplitude of these echoes might have been attenuated by the motorcycle’s windshield [32]. Nonetheless, objectively the match was a less than perfect 11 out of 13. Furthermore, two large peaks in the evidence pattern were not matched in the test pattern, which therefore cannot be gunshot echoes [33]. Conceivably these peaks could be attributed to static. The pertinent question is, given 15 impulses on the evidence tape and 13 echoes on the test pattern, what are the odds that 11 peaks would be coincident to within 1 msec. The factors that enter into this calculation go to the heart of the discrepancy in the value of p, computed by the HSCA and NRC panels.
Statistical Analysis of Echo Delay Time Coincidence
The value p in this case is calculated in the same manner that lottery or casino odds are calculated. The probability is defined by the hypergeometric function, p{M,N,n,i}, where, M = the number of windows where a spike could appear, N = the number of spikes in the test pattern, n = the number of spikes in the evidence pattern, I = the number of coincident spikes. The hypergeometric function is appropriate for comparisons of two finite populations which are sampled without replacement [34]. In this case each match depletes the number of potential impulses available for each succeeding window. The formula for the calculation of the hypergeometric p involves factorials and is:
![]()
The null hypothesis holds that the radio impulses were generated by a source other than gunshot sounds, and if so, then occurrence or absence of a peak at any given window is determined by chance and the frequency of impulses. It was an unstated assumption of the analysis that whatever generated the impulses on the evidence tape would have generated impulses at the same approximate frequency as a gun-shot in Dealey Plaza. The NRC report noted that the HSCA’s calculation of p contained errors. This was true. The errors seem to have arisen because one laboratory (New York) provided the data, while the second laboratory (Cambridge) calculated the value of p. The latter made two overt errors in assigning values to the parameters M, N, n and i. The first was quite simple. The matching procedure begins with the alignment of the first peak in each pattern, the impulse corresponding to the muzzle blast. Because these impulses are aligned deliberately they cannot be scored as a match. Only the peaks representing echoes were free to coincide or not. Therefore, the number set 15, 13, and 11, must be reduced to 14, 12, and 10 for the values of N, n and i respectively. The researchers in Cambridge began their analysis with the number set representing the echoes but then made the correction for the deliberate alignment of the first spike, failing to recognise that the correction was already built in, then compounded the error by only reducing the value of i, the number of coincidences, by one, giving an erroneous number set of 14, 12, and 9 for N, n and i, respectively, in their analysis [35].
A second error involved the value of M, the number of windows. The test pattern was 370 msec in duration. Inasmuch as the scoring of coincidence was based on a proximity of ±1 msec, each window was 2 msec wide and there should be 370/2 = 185 windows. However, in this particular instance, the echoes arrive in two discrete clusters. The echoes originating with the structures on Elm Street arrive within the first 85 msec. The echoes originating with the structures farther back on Houston Street arrive in the last 95 msec [36]. The 190 msec gap between the clusters corresponds to the open space at the intersection of Elm and Houston. The evidence tape has the same pattern of peaks in two clusters. It was reasoned that if some unidentified phenomenon was generating clusters of impulses, then only the time span including peaks should be incorporated in the analysis. Thus, the 190 msec open span is eliminated and the appropriate time span would be 180 msec, and therefore, the value of M would be 180/2 = 90 windows. The HSCA report states erroneously that the patterns arrive in two clusters encompassing a total of 90 msec [37]. Thus, an erroneous value of 90/2 = 45 windows was assigned to M.
The adjustment of the M value is particularly noteworthy with respect to a contention made by the NRC panel. The NRC panel argued that the calculation of p, using the hypergeometric function assumes a Poisson distribution. If the source of the impulse patterns was some non-white noise the distribution of peaks might be non-Poisson and therefore have a different probability [38]. However, the NRC panel offered no evidence nor suggested any non-white noise phenomena that might account for the impulse patterns. Their argument also overlooked that in making the assumption requiring that the frequency of impulses would be the same approximate number as that generated by gunshot echoes, and by constricting the time span only to that encompassed by the impulses, the HSCA analysts had in fact incorporated an adjustment for any statistical bias against a Poisson distribution.
In any event, the HSCA analysts used an erroneous number set for {M,N,n,i} of {45,14,12,9}, which for the reasons explained above, should have been {90,14,12,10}. With 14 peaks in one pattern and 12 peaks in the other, the chances of getting nine coincidences out of 45 windows is 3.13 x 10 ~, and was so reported [39]. This is not the final value of p, however. Another adjustment is required because the analytically determined motorcycle position was a free variable. Theoretically, there were 180 possible microphone positions. This is the equivalent of purchasing 180 tickets to increase one’s chances of winning a lottery. Thus, the value 3.13 x 10⁻⁴ has to be multiplied by 180, giving the final value for p, of 0.0563 (the HSCA report gives 0.053 [40]). Had these analysts not committed the aforementioned errors and used the data set {90,14,12,10}, the odds would be 1.04 x 10⁻⁸ and multiplying by 180 gives a final value for p, of 1.87x 10⁻⁶, or about 50,000 to one, against.
The NRC panel was aware of some of the errors made by the HSCA consultants in the calculation of p and identified others that they described as 'errors of statistical reasoning.' The NRC panel calculated that with these errors eliminated the correct value of p was 0.223 [41]. However, I will show that the NRC calculation was, also, not correct.
Firstly, the NRC panel recognised that the correct value of M was 90 and not 45. Thus, they began their analysis with the number set reported by the New York lab, with the correction for M giving {90,14,12,10}. The NRC panel then adjusted these numbers to account for what they judged to be errors of statistical reasoning.
Close scrutiny of the data revealed discrepancies in the scoring procedure with respect to two pairs of echoes. One pair of echoes, designated numbers 19 and 20, were separated by only 3 msec on the test pattern [42]. Applying the sonar model to the echo delay times predicted that these two echoes would have arrived precisely coincident with one another when the microphone is moved to the predicted motorcycle position [43]. In fact, there is only one peak in the evidence pattern at the corresponding echo delay location. The HSCA analysts scored the two echoes as separate coincidences giving a contribution of 2, 2, and 2 to the values of N, n and i respectively. The NRC panel took the position that because there really is only one peak on the evidence pattern in this position, and one on the predicted pattern, the contribution to N, n and i should have been 1, 1, and 1 respectively. Because there really are two echoes involved, the assigned values were not really an error on the part of the HSCA. Rather, of the two reasonable alternative scoring procedures the NRC procedure was simply the more conservative. However, to avoid a type II statistical error, the conservative approach should be adopted. This results in a number set of {90,13,11,9}.
A similar problem involved echo numbers 23 and 24. On the test tape they are separated by 5 msec [44]. The sonar model predicts their arrival will be much closer, though not exactly coincident, approx 1 msec apart, when the microphone is moved to the predicted motorcycle position [45]. Likewise, the two echoes on the evidence tape at this echo delay location are approx 1 msec apart [46]. The HSCA analysts scored the two echoes as contributing values of 2, 2, and 2 to the parameters N, n and i, respectively. But, the NRC panel argued that the coincident windows should be non-overlapping, and because the windows are 2 msec wide the scoring should count only one coincidence not two. Inasmuch as there really are two echoes on the test tape, two separate peaks on the evidence tape, and two predicted echoes on the sonar model, the reduction from two to one coincidences seems overly conservative. In fact, the NRC panel scored the contributions to the parameters N, n and i as 1, 2 and 1, respectively, in effect, insisting on counting an echo for which they would not allow a match. Even accepting the overly conservative approach to scoring which insisted on non-overlapping windows, their assigned score was clearly inappropriate. By the NRC scoring the number set was now {90,12,11,8}.
Then, according to the NRC panel, the individual parameters that went into the sonar model should be considered as free variables. For example, the location of the motorcycle microphone was found by trying different possible locations until a best fit was found. The HSCA factored this parameter into the estimate of p by multiplying by a factor of 180, the number of potential microphone locations. The NRC panel reasoned that each free variable could be treated as a degree of freedom and that an appropriate number of df could be deducted straight from the values of the parameters defining p. In the case of the motorcycle location, instead of multiplying by 180, 2 df could be deducted because the microphone position was free to vary in two dimensions. Likewise, they argued that 2 df could be deducted for the shooter location. An additional df could be applied to the function in the sonar model which adjusted for tape speed and air temperature, another for motorcycle speed and one for “time of shot,” for a total of 7 df [47]. Deducting the 7 df the NRC panel arrived at a final number set of {83,5,4,1} [48]. The value of p calculated from this number set is 0.207 (NRC reported 0.223 [49]).
The NRC report contains the admission that their estimate of p maybe somewhat ‘unduly conservative’[50]. This was true. While the possible motorcycle position was certainly free to vary in two dimensions, this was not true of the shooter position. The shooter could not have been any distance away from the fence on the Grassy Knoll, and thus was not truly free to vary in two dimensions, but only along the fence. Only 1 df might have been taken for this variable. The other factors that went into the sonar model: air temperature, motorcycle speed, and tape speed, were not variables at all but actual measurements. Had these known factors not been included in the sonar model the model could be truly criticised as invalid. Certainly these measurements were subject to a degree of inexactitude. The digital thermometer that measured ambient temperature in Dealey Plaza was on the roof of the Book Depository. Such thermometers are usually accurate to only about ±1.50C. But, the sonar model was not particularly sensitive to any reasonable range of variation in these parameters. For example, the HSCA analysts used a correction factor of 4.3% for tape speed instead of the 5% measured deviation to obtain the best fit. Again, though, the 5% deviation was only an average. Because the Dictaphone was not a precision device the instantaneous tape speed varied between 4 and 7 percent. The value could have been set at 5% and instead corrected the air temperature value and still arrived at the precise fit even if the temperature was as much as 40C different [51]. The fact is that these values were, at the very least, reasonable assumptions, and certainly not free variables to which any value could be assigned in order to achieve a match, as was the case with the shooter and motorcycle locations.
Finally, one of the NRC deductions was an overt error. In assigning 1 df for the parameter “time of shot” they were, in fact, adjusting for the artificial alignment of the first impulse, the muzzle blast. But that correction had already been included in the number set {90,14,12,10} with which the NRC began. If instead of {83,5,4,1}, one takes back just 1 if for the latter overt error, ignoring the other unduly conservative adjustments, the number set {84,6,5,2} has a p of 0.037, and the null hypothesis would be rejected. The more appropriate estimate of p would include 2 df for motorcycle location, one for shooter location, one for the alignment of the muzzle blasts, and eliminate one pair of echoes and their coincidence (from pairs 19 and 20), giving a final number set of {86,10,8,6} which has a p of 1.12 x 10⁻⁵, or, 100,000 to one, against. Thus, one can conclude that the resemblance of the impulse pattern on the Dallas Police tape to the echo delay pattern of a gunshot from the Grassy Knoll was unlikely to arise from a chance array of radio noises.
Order in the Acoustic Data
An issue not addressed in the NRC report concerns the degree of order in the data. It was this evidence that led the HSCA consultants to conclude that the sounds on the tape were the assassination gunshots, whether or not a Grassy Knoll shot was included. All five of the evidence patterns matched to test patterns with a correlation of 0.6 or better [52]. Because of replication built into the experiment most matched to more than one test shot, usually at the same or an adjacent microphone position (Table 1). The test pattern giving the highest correlation value was judged to be the “true” match. Regardless of the odds against achieving a match, if the evidence patterns are not gunshots, then any matches are spurious and there is an equal chance of achieving a match at any microphone position. In fact, the matching of the five putative shots were to five microphone positions in the correct topographic order (Figure 3). The probability that they would line up in the same topographic order as their chronological order is p = 0.008 (125 to 1) which by itself would justify rejecting the random noise hypothesis.
Moreover, not just the order but the spacing was correct. The time lapse between the five matching impulsive sounds was 1.7, 1.1, 4.8, and 0.7 sec on the evidence tape. The first three impulses obtained their highest matches (binary correlation coefficients) at three consecutive microphone locations designated 2(5), 2(6), and 2(11) respectively, which were spaced at 6 m increments on Houston Street. The fourth sound matched to a microphone location on Elm Street designated 3(4), 24 m removed from 2(11) at the intersection with Houston; and, the last sound matched to a pattern recorded at the very next microphone location 3(5). Thus, the order and spacing revealed by the matching procedure is an accurate fit with the hypothesis that the sounds were gunshots captured on a microphone of a motorcycle traveling north on Houston Street then westerly on Elm Street at the time of the assassination. Furthermore, the distance between microphones 2(5) and 3(5), was 43 m. To travel 43 m in 8.3 sec requires a microphone trajectory of 18.8 km/hr. The latter value, calculated from the acoustic data obtained in 1978, compares to the FBI laboratory’s measurement from filmed evidence that the President’s limousine averaged 18 km/hr through Dealey Plaza [27]. It was this order in the data, not just the echo correlation matching, that compelled the HSCA to conclude that the sounds of the assassination gunfire were recorded on the Dallas Police Dictabelt.
Synchronization of acoustic Signals and Events with Cross-Talk
The NRC panel found evidence that the acoustic patterns identified as gunshots were not synchronous with the assassination, and therefore concluded that the impulses could not be the gunshots that killed President Kennedy. However, on closer examination it is found that the evidence of asynchroneity depended more on assumptions concerning the events that occur on the two separate channels rather than the events themselves.
By context, the shooting had to have occurred in an 18 sec interval between two transmissions over channel two, the first of which announced the position of the motorcade on Elm Street, and the latter of which was an urgent broadcast by Chief Curry to, “Go to the Hospital!” [53]. The putative gunshot sounds occur on channel one. One-half second after the last putative gunshot there is a garbled voice transmission which appears to say, “…hold everything secure." Sixty seconds after the “Go to the Hospital!” transmission on channel two, Dallas County Sheriff Bill Decker took the microphone and broadcast a statement which included the phrase, “…hold everything secure...” [54].
The presence of the phrase on both channels is presumed to be radio cross-talk wherein a transmission is picked up by an open microphone and rebroadcast simultaneously over both channels. The significance of cross-talk is that it allows one to synchronize events on the two channels to real time. The presence of this garbled fragment of Decker’s channel two broadcast over channel one provided the NRC panel with evidence that the gunshot-like sounds were not the assassination gunfire. Inasmuch as the channel one transmission of the Decker broadcast occurs only 0.4 sec after the last putative gunshot on channel one, but 60 sec after the Curry broadcast on channel two, the impulsive sounds have to occur nearly a full minute after the shooting, and therefore, cannot be the assassination gunfire [55].
But, the NRC panel overlooked the significance of a second instance of cross-talk. On channel two, 180 sec after Chief Curry’s transmission, a patrolman named Bellah broadcast,
“You want me to hold this traffic on Stemmons until we find out something, or let it go.” [56]
The same complete broadcast occurs with clarity on channel one, 171 sec after the putative gunshots. If one decompresses the elapsed tape time of 171 seconds by 5% we arrive at an elapsed real time of 179 sec. Thus, if one uses the Bellah cross-talk to synchronize the transmissions of the two police channels, instead of the Decker calls, then the putative gunshots exactly overlap the interval of time defined by Chief Curry’s two broadcasts and occur at the exact instant that John F Kennedy was assassinated.
The NRC panel failed to recognise the synchronization that arises from using the Bellah cross-talk episode because instead of using real time to compare the two tapes, they used artificial time, what they referred to as “channel one” time [57]. Because they used artificial time instead of real time, they failed to recognise the need to correct for the warp in tape speed. The NRC panel used artificial time instead of real time because of a mistaken assumption concerning the sound activation feature of the police recording system. Both recording machines were equipped with a sound activation switch which was set to shut off the recorders whenever there was dead air for more than about 4 sec [58]. In the case of channel one the motorcycle motor noise assured that the off-switch would not trip. The NRC panel reasoned that elapsed tape time on the channel two recording could not be related to real time because it was not possible to know for how long the recorder would have been switched off [59]. However, the NRC panel overlooked the regression analysis of elapsed tape time against dispatcher notation time performed by the HSCA panel. It was this analysis which first revealed the 5% lag in the channel one recording, e.g., the slope of the regression line was 0.95. On channel two, over the six minutes prior to Curry’s broadcasts at 12:30 the slope of the regression line of time notations against elapsed tape time on channel two was only 0.4 [60], indicating a poor relationship due to lost time. But over the six minutes immediately after Curry’s broadcasts the slope of the regression line was a perfect 1.0 [61]. Thus, there can be no significant amount of lost time on channel two after 12:30, and certainly not a whole minute out of a three minute interval. Because of these oversights the NRC panel failed to consider the importance of the fact that time was compressed by 5% on channel one, and failed to recognise that no time was lost on channel two after the shooting. For those reasons they also failed to recognise that the 11 sec sequence of gunshot-like impulses on channel one falls neatly into the 18 sec interval between the two Curry broadcasts that bracket the time of the shooting on channel two.
Clearly, one of the two cross-talk episodes is chronologically out of place because they are 180 sec apart on channel one but only 120 sec apart on channel two. There are two proposed explanations for the discrepancy. The NRC panel assumed that the channel two recorder must have stopped for a total of 60 sec during this interval. Alternatively, the lead scientist for the HSCA study suggested that the barely audible fragment of Decker’s broadcast could be an over-dub; the result of the recording needle jumping backward in its track [62].
Because the regression analysis shows that no time is missing from the relevant section of the channel two tape, then the fragment from Sheriff Decker’s broadcast is only explained by the overdub hypothesis. The NRC panel’s conclusion that the interval containing the putative gunshot sounds was not synchronous with the shooting was based on assumptions not in accord with the evidence.
Acoustic identification of the Weapon on the Grassy Knoll
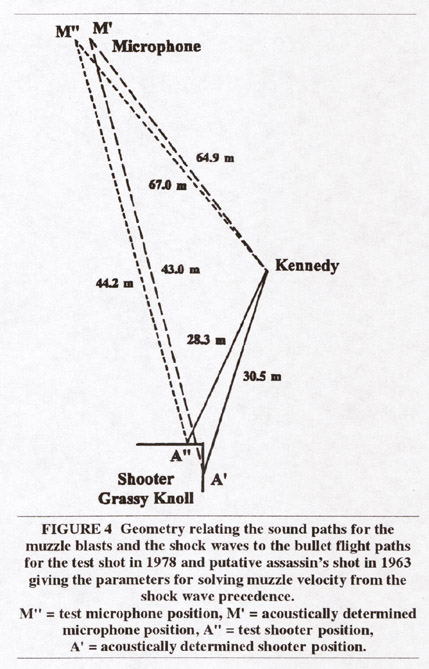
The determination of the calibre of the weapon on the Grassy Knoll from its acoustic fingerprint requires accurate knowledge of the bullet’s trajectory. If it is assumed that the bullet missed, then its trajectory is unknown. If it is assumed that the shot from the Grassy Knoll was the fatal shot, then its trajectory is known and the calibre of the weapon is deducible from the shockwave precedence. In this particular case, the analytically identified microphone location happens to be in the line of fire. Because the microphone location is in the line of fire the test recording picked up the N-shaped shock wave of the bullet. Because rifle bullets exceed the speed of sound, the shock wave precedes the arrival of the muzzle blast at the microphone, if the microphone is near the line of fire. The magnitude of the shock wave precedence is a function of the distance from the blast to the microphone, the path of the bullet, the distance from the bullet’s path to the microphone, the speed of sound in air at the time of the shot, and the velocity of the bullet. All of these parameters are known, except the latter, which can then be solved by factoring-in the shock wave precedence. Knowing the velocity of the bullet and the distance that it traveled, one can estimate the muzzle velocity. The muzzle velocity is characteristic of specific cartridges and can be found in tables of ballistic specifications.
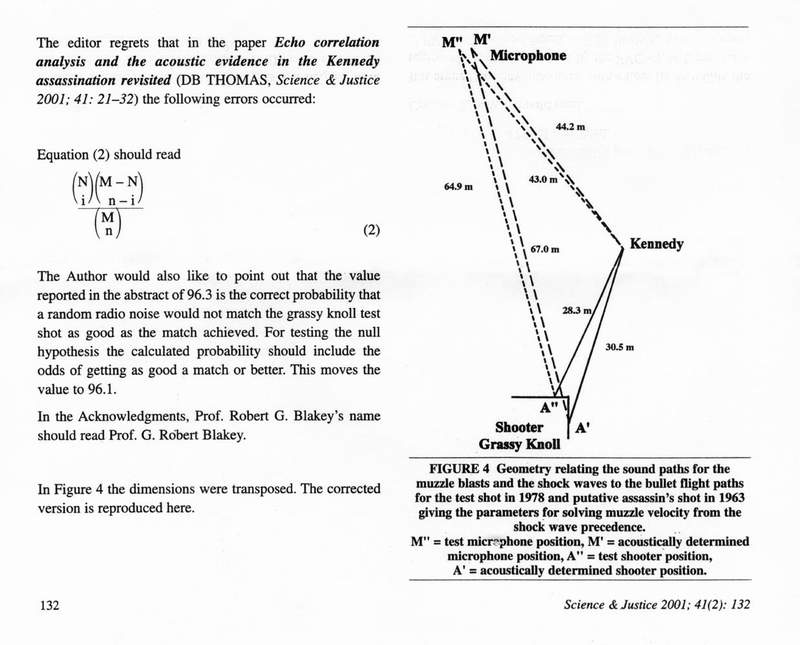
First, the parameters of the test shot fired in August 1978 are delineated in order to calibrate the measurements. The police marksman was located 1.2 m north of the corner of the fence on the Grassy Knoll. The distance from the shooter position to the target was 28.3 m. The distance to the test microphone was 64.9 m. The ambient temperature was 320C giving a sound velocity of 350 m/sec. The muzzle blast would arrive at the microphone 185.2 msec after the shot. Because the shock wave precedence on the recording is 14 msec [63] it took only (185.2 - 14 =) 171.2 msec to take the path which brings it to the microphone. Due to the alignment of shooter and target, the closest that the bullet path ever came to the microphone was the instant before it hit the target which was 44.2 m distant. The shock wave travels at the speed of sound and thus takes 126 msec to travel that distance. The difference, (171.2 - 126 = ) 45.2 msec, is thus the time taken by the bullet to travel the 28.3 m to the target. This calculates to an average velocity of 627 m/sec. The nominal muzzle velocity of the Norma 6.5 mm Mannlicher-Carcano military loads used in the test shooting was 700 m/sec [64]. The difference, about 11.5% is attributable to air resistance and provides us with a correction factor that will be used in the final computation (Figure 4).
The analytically determined microphone location was 1.2 m closer to the President, a distance of 43 m. The acoustically determined shooter location was 2.4 m west of the corner of the fence and thus the distance to the President was 30.5 m. The distance from the assassin to the motorcycle was 67 m. The air temperature at the time of the assassination was 1 80C and thus the speed of sound was 342 m/sec. The muzzle blast would arrive at the motorcycle in 195.9 msec after the shot. The shock wave precedence on the evidence tape was 24 msec [65]. However, that value has to be adjusted 4.3% for tape speed giving 25 msec. Thus, the shock wave arrives at (195.9 - 25 =) 170.9 msec after the shot. Because the motorcycle was 43 m behind the President the shock wave requires 125.5 msec to travel from the President to the motorcycle, leaving 45.4 msec for the bullet to travel the 30.5 m from the Grassy Knoll to the President. This calculates to an average bullet velocity of 671.2 m/sec, and correcting 11.5% for air resistance gives a muzzle velocity of 748 m/sec. Because the shooter location has an inexactitude of ±1.5 m, the estimate must be assigned an error of about +32 m/sec.
A check of ballistic tables from 1963 [66] shows more than a dozen commercially available cartridges with a muzzle velocity of 748 +32 m/sec, most of them in the .30 calibre range. The popular .30-30 Winchester with a muzzle velocity of 735 m/sec falls in this category and is noteworthy in the context of the Dallas Police tapes. At 12.45 pm, 15 mm after the shooting, a police officer in Dealey Plaza radioed in the following information over channel one:
“The wanted person in this is a slender white male about thirty, five feet ten, one sixty five, carrying what looked to be a 30-30 or some type of Winchester.” [67].
Summary and Conclusions
The validity of acoustic evidence for a gunshot from the ‘Grassy Knoll’ was challenged on statistical grounds and on the basis of an anomaly on the Dallas police recordings. However, the assumptions underlying those criticisms were not in accord with evidence overlooked by the review panel. With a rigorous statistical analysis one arrives at a calculation for the probability that the recording contains a random pattern which by chance resembled the acoustic signature of a gunshot from the Grassy Knoll at no more than p = 0.037.
The NRC panel asserted that radio cross-talk indicated asynchroneity between the putative gunshots on channel one and the time of the assassination revealed by context on channel two. The NRC panel overlooked that an alternative synchronization arises from the radio cross-talk evidence because of the fact that the two identifiable cases of cross-talk were out of synch with one another. The episodes are three minutes apart on one channel, but only two minutes apart on the other. Had the unambiguous instance of cross-talk been used, instead of the barely audible fragment of cross-talk, the supposed asynchroneity in the evidence would have been resolved. The unambiguous cross-talk evidence indicates that the gunshot-like sounds on channel one were recorded over the police radio at the precise instant in real time that the President was being assassinated by gunfire.
The order in the data, that is, the congruence between the acoustic evidence and the sequence of events derived from a reconstruction of the crime from video evidence is the major factor that led acoustic experts to conclude that there was a gunshot from the Grassy Knoll during the assassination. The critiques of the acoustic evidence by the NRC panel and the FBI laboratory failed to consider that evidence. There was a further incongruity in the arguments of the NRC panel, and perhaps irony, in that a broadcast over the police radio sent one minute after the assassination giving orders to search behind the Grassy Knoll for an assassin, was invoked as evidence that there was no assassin on the Grassy Knoll.
Acknowledgements
I am grateful to James E Barger of Bolt, Baranek & Newman for his comments on the manuscript and patient explanation of the concepts behind his analysis. Also, to Stephan Barber of Mansfield, Ohio, for information relative to his discovery of the Decker cross-talk. Robert G Blakey, Notre Dame University, Brett C Ratcliffe, University of Nebraska, and Gary Mack of the Sixth Floor Museum, Dallas Texas, reviewed and commented on a draft of the manuscript. Chris Man Van Dyke of McAllen, Texas, assisted with the figures.
Errata published in the following issue of Science & Justice: